What's News
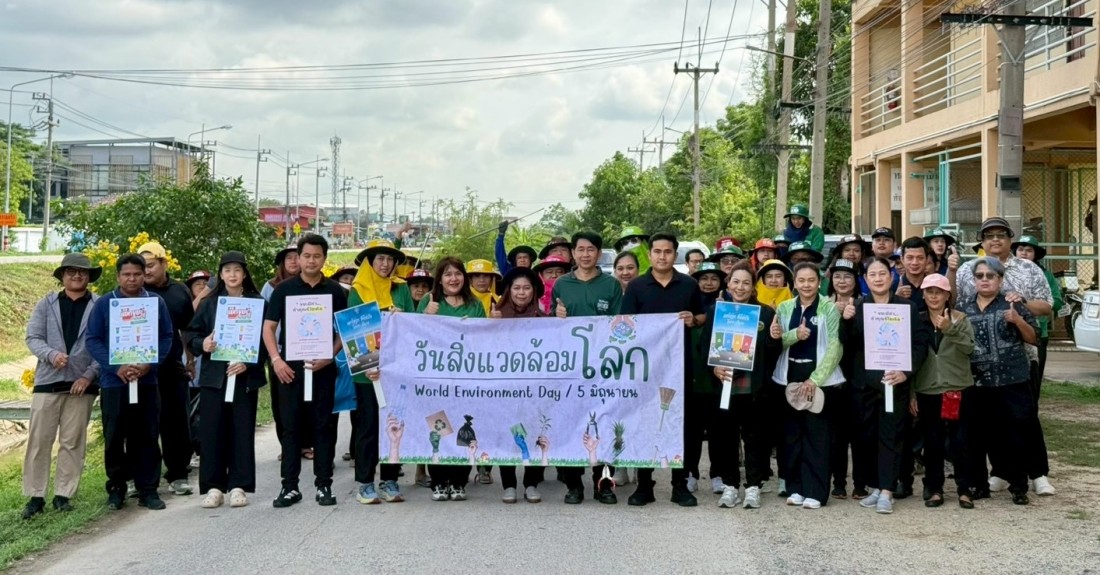
CSR News & Activity
Thai Central Chemical Public Company Limited Joins Forces with Farmers and University Parter to Advance Low-Carbon Rice Farming for Sustainability
CSR News & Activity
Thai Central Chemical Public Company Limited continues to share the power of giving by donating aluminum cans and pull tabs to support a prosthetic leg funding project.
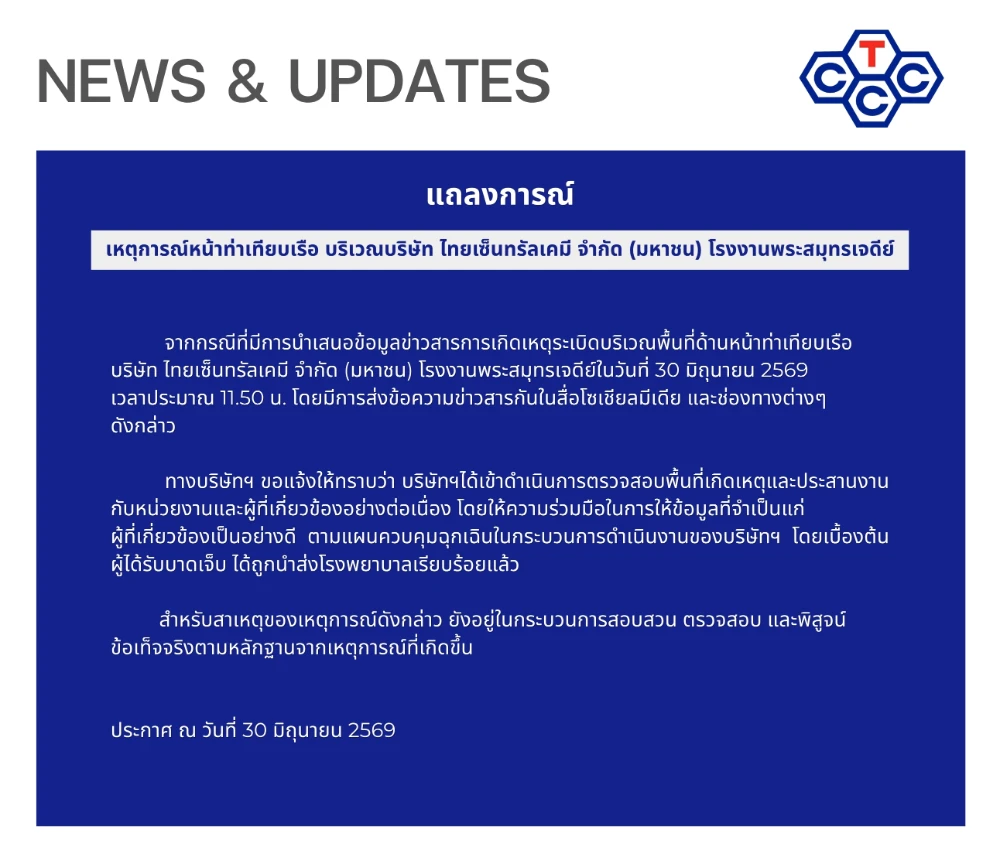
News